Normal
Evidence
Channels remain within their expected ranges; data is complete.
Recommended action
Continue routine monitoring.

Pressure trends reveal overall change. Local structural signals add spatial information. VELA is designed to bring them together.
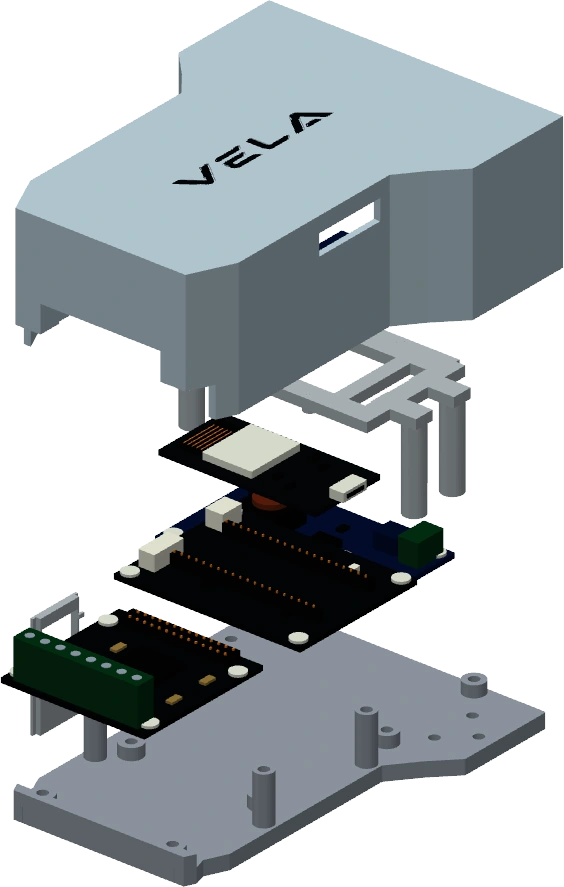
The intended workflow links routine monitoring to inspection. Acquisition and logging are working in the prototype; adaptive capture and area ranking are in development.
Place fixed sensors and map their positions before service.
Record each channel under known normal conditions.
Track pressure and local signals on a shared timeline; selective higher-rate sensing is planned.
Compare channels with their own baselines, then combine nearby responses and repeated evidence.
Recommend a region for local confirmation; record the inspection result and update the baseline when appropriate.
Pressure fluctuation and localized structural response offer complementary information.
The planned network wakes selected nodes for higher-resolution capture when a trend diverges.
Rank areas rather than reporting an unsupported exact leak coordinate.
A channel’s mounting and background vibration affect its normal signal. Per-channel comparison is central to VELA’s proposed analysis.
A sensor near a pump may be louder than one near a leak. Comparing absolute amplitudes alone risks measuring the installation rather than the event.
Use each sensor’s healthy record as a reference for features such as RMS and energy. Combine pressure conditions, nearby responses and repeated trials to support a region ranking.
S2 has the largest relative change—not a confirmed leak location.
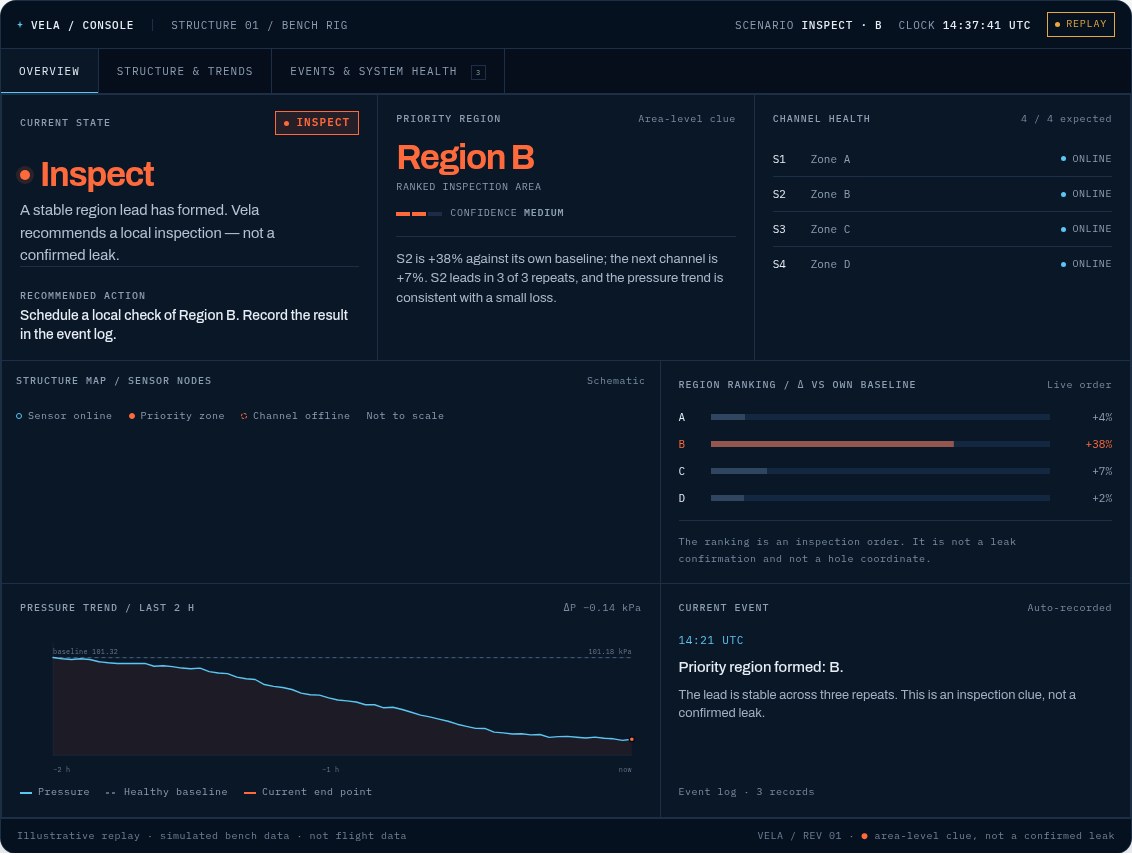
This is the monitoring interface’s decision model; the interactive console demonstrates the intended actions.
Try the interactive consoleChannels remain within their expected ranges; data is complete.
Continue routine monitoring.
A change is present, but the region order is not stable.
Observe, collect more data or check operating conditions.
A consistent region lead has formed in the intended workflow.
Prioritize a local check and record the outcome.
Channels are offline, data is incomplete or evidence conflicts.
Check channel health or collect a complete window before ranking.
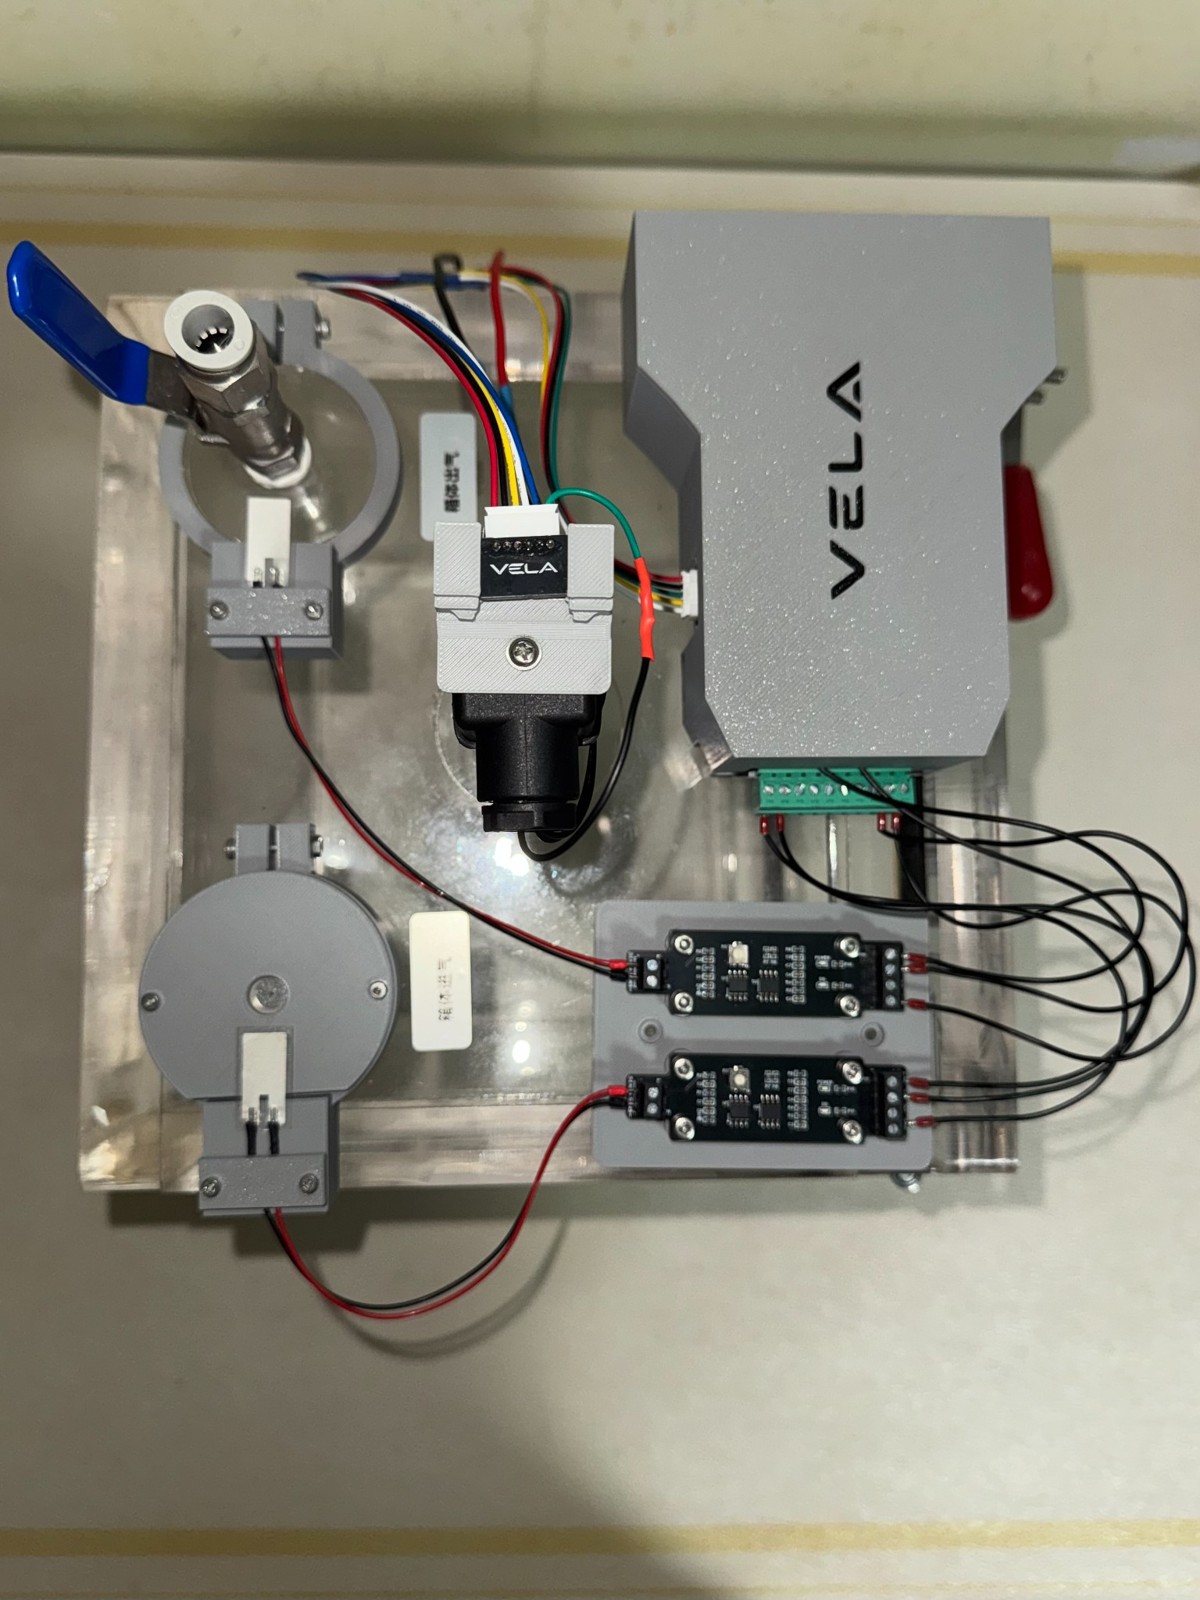
VELA’s development focuses on calibration, sensor selection, synchronization and evidence fusion. The architecture is designed for modular expansion across pressurized structures.